Erfahrungsheilkunde
Acta medica empirica
Journal for medical practice
Offprint (EHK7/1998)
Peter Kreisl
Summary
The transfer of bioenergetic information facilitates a new scientific approach to the specialist area of biology, in particular methods of medical diagnosis and therapy. This paper demonstrates that, by transferring acetic acid information to inorganic salt solutions by means of an electronic amplifier, the phsyco-chemical properties of the solutions informed in this way are subject to significant and measurable changes. The effect of information transfer can be detected in three different experimental test parameters.
The pH of the informed inorganic salt solutions decreases slightly but significantly. Kirlian photographs of droplets of untreated and informed samples show very impressive differences with regard to corona intensity and strength (intensity and length) of the transmitted radiation. This indicates that the density of free charge carriers increases in the treated samples.
On drying the inorganic salt solutions, crystals were obtained and analysed under an electron microscope. This showed that crystals from informed samples showed a pronounced tendency to larger crystal sizes and extended agglomerates, depending on the amplification of the transferred acetic acid information,
Introduction
The currently generally accepted principle of therapy for treating almost all diseases is based on the assumption of appropriate active substance/receptor interactions and the changes triggered by these in biochemical processes.
Energetic regulatory principles, such as underlie e.g. acupuncture, homeopathy and bioresonance therapy, are still largely overlooked in the biochemically oriented model of living organisms.
Although important diagnostic methods are based on electromagnetism, and thus the energetic properties of living organisms, such as e.g. EEG, ECG, EMG, computer tomography and the so-called SQUID magnetometer, only bone diseases [1] and certain forms of epilepsy [2] are treated with electromagnetic fields to any real extent.
This is all the more surprising because extensive experimental results are now available which, on the one hand prove the physiological basis of the natural philosophical way of looking at the phenomenon known as disease and, on the other hand, demonstrate the connection between the energetic regulator), systems postulated in this approach and the electromagnetic properties of a wide variety of organisms, using the methods of modern western natural science [3-7].
The current work is part of more than three year’s research activity at the Institute for Regulatory Medicine into the scientific basis of BICOM resonance therapy [8-10]. The experimental data were obtained within the context of a degree dissertation for the Faculty of Electrotechnology at the University of Ljubliana by N. Rojko Vuga, supervised by Prof Dr. A. Jeglic.
Methods
Measurement area
The experiments were performed in an electronically shielded and sound-proof laboratory at the Faculty of Electrotechnology at the University of Ljubliana, Institute Josef Stefan, using two BICOM instruments in parallel.
Reagents
Extremely pure acetic acid; deionised ultrapure water as solvent for the inorganic salt solutions;
Stock solutions:
0.035 M Na2CO3
0.035 M CaC12
10 ppm FeC12
10 ppm ZnC12
10 ppm CuCI
Composition of the inorganic salt solutions:
Sample 1
2.5 ml water, 1.25 ml sodium carbonate stock solution, 1.25 ml calcium chloride stock solution.
Sample 2
0.7 ml water, 1.8 ml iron(II) chloride, 1.25 ml Na2CO3 solution, 1.25 ml CaCl2 solution.
Sample 3
1.0 ml water, 1.5 ml zinc chloride solution, 1,25 ml Na2CO3 solution, 1.25 ml CaC12 solution
Sample 4
0.9 ml water, 1.6 ml CuCl solution, 1.25 ml Na2CO3 solution, 1.25 ml CaC12solution.
Equipment
Two BICOM instruments, from Regumed GmbH, Greeting
Drying the samples
Drying chamber SB 11: electronically controlled. The sample droplets were dried on a microscope slide at 70°C, relative humidity 40%, for one hour.
A pH meter MA 5750 ISKRA with an accuracy of ± 0,01 was used for measuring the pH.
Bioplasrna detector for Kirlian photography: electrical strength 1, discharge time 10 sec, at frequency transmission 30 Hz.
Electron microscopy
A JEOL JSM 5800 electron microscope combined with a PC and printer were used for analysing the crystal structures. Magnification: 2000x.
Performing the tests
All samples and reference solutions were stored in air-tight, sealed 5 ml cells (glass). To transfer the electromagnetic information from acetic acid (HOAc), a sealed cell containing HOAc was placed in the input cup (brass: alloy MS 63) of the BICOM instrument. Each of the test substances was placed in the output cup made of the same material The reference samples (untreated samples) were also placed in an applicator cup alongside the same instrument. However, this applicator cup was not connected to the BICOM. Information transfer from HOAc to the test samples was performed in the frequency range from 10 Hz to 150 kHz (treatment type A) with amplification factors 0.1, 1, 15 and 30, for 10 minutes each.
After completing information transfer, the pHs of the sample solutions and reference solutions were determined. This measurement was repeated one hour later. Kirlian photographs were then taken of a droplet of sample or of untreated reference sample. For electron microscopic analysis of the crystal structure, 15 [1.1 of each of the solutions was pipetted onto a microscope slide and dried.
Results
Determination of the pH of the treated solutions as compared with untreated inorganic salt solutions showed a slight, but clearly measurable, decrease in pH. As shown in table 1, treated samples 1 and 2 showed a clear decrease in pH which depended on the amplification (A = 30 and A = 64) of 0.06/0,07 and 0.12/0.21. In order to definitely exclude a thermal effect, samples I and 2 were subjected to an external (artificial)
50 Hz alternating field with a magnetic field strength B = 10 mT for 10 minutes. The samples tested then produced a pH decrease of only 0.02 each.
Table 1: Decrease in pH of alkaline inorganic salt solutions due to transfer of acetic acid information
Type of treatment Sample 1 Sample 2
A, amplification 30 9,90 9.78
A, amplification 64 9.84 9.64
untreated 9.96 9_35
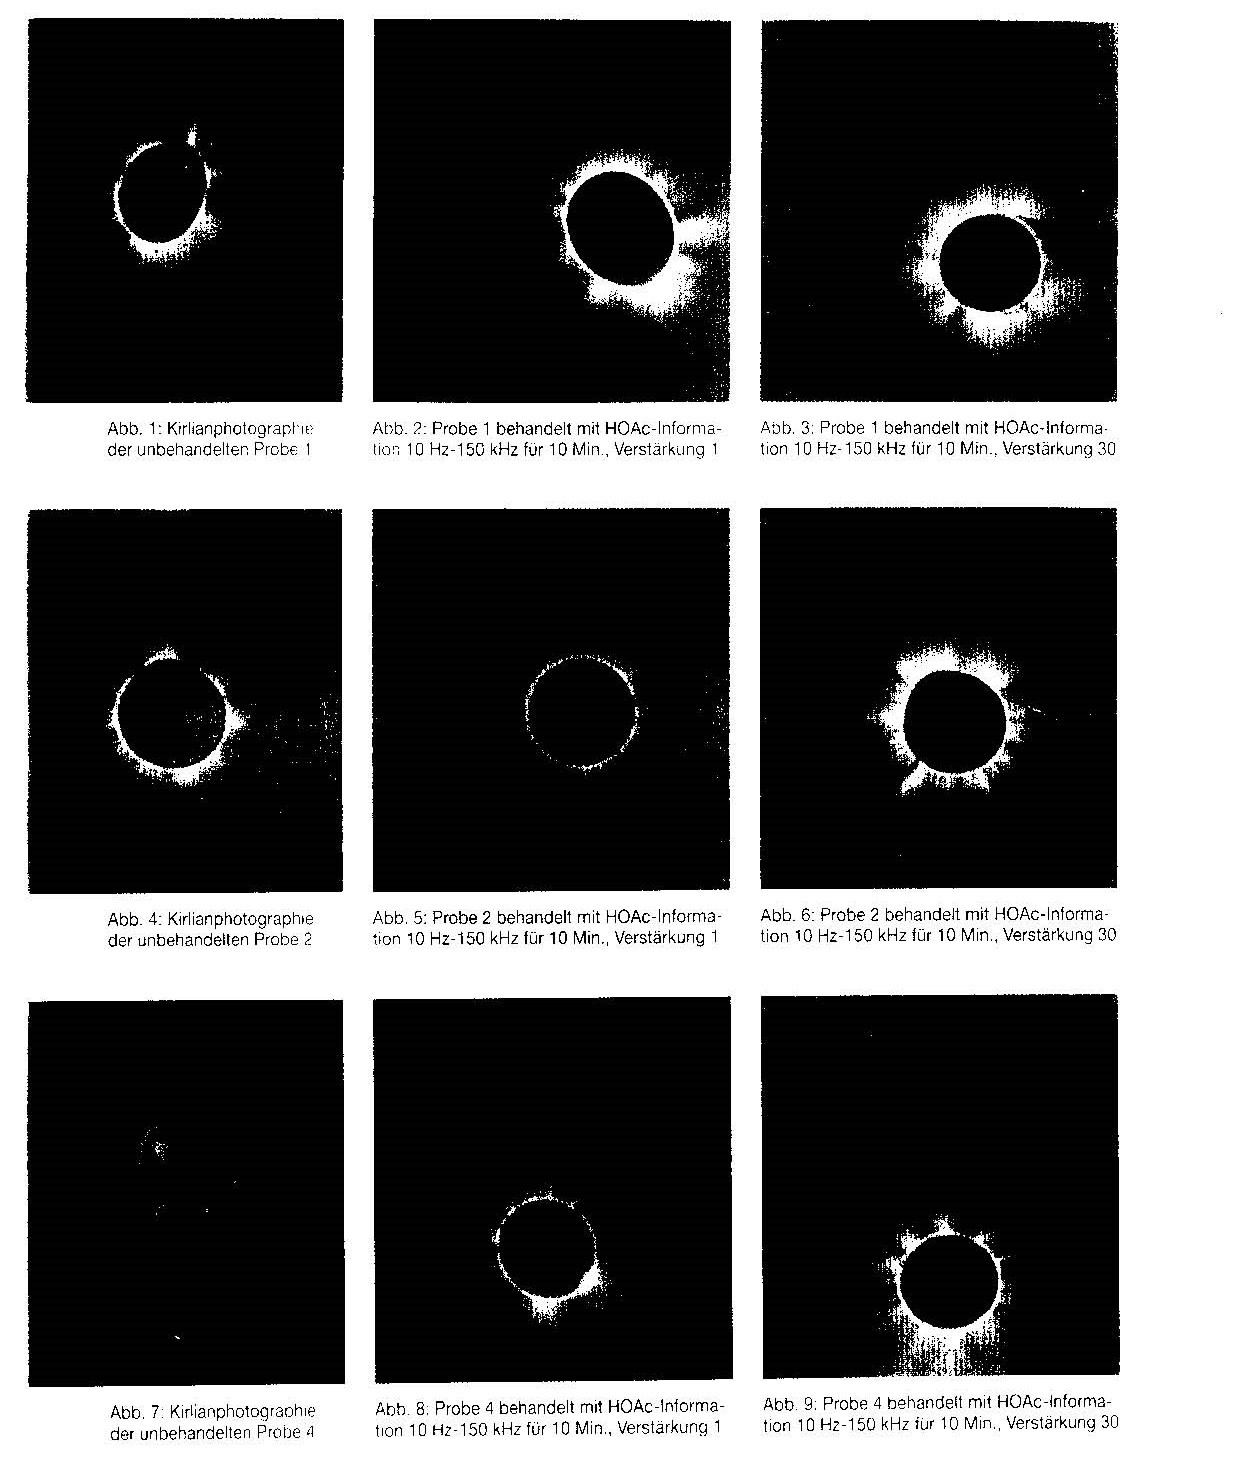
The images from Kirlian photography are shown in figures 1 to 9. As can be seen, the treated inorganic salt solutions are characterised by an impressively increased radiation density in the corona and wide-ranging transmitted radiation, depending on the amplification applied when transferring the HOAc information. The importance of this drastic change in the appearance of the energetically treated inorganic salt solutions can be acknowledged at the present only as a real phenomenon.
In order to find out whether the energetic effects of the HOAc information, in the sense of a perturbation in the crystallisation behaviour of the treated mineral salt solutions, can still be detected in the solid aggregate state, the samples and reference solutions were crystallised under controlled conditions and measured under an electron microscope.
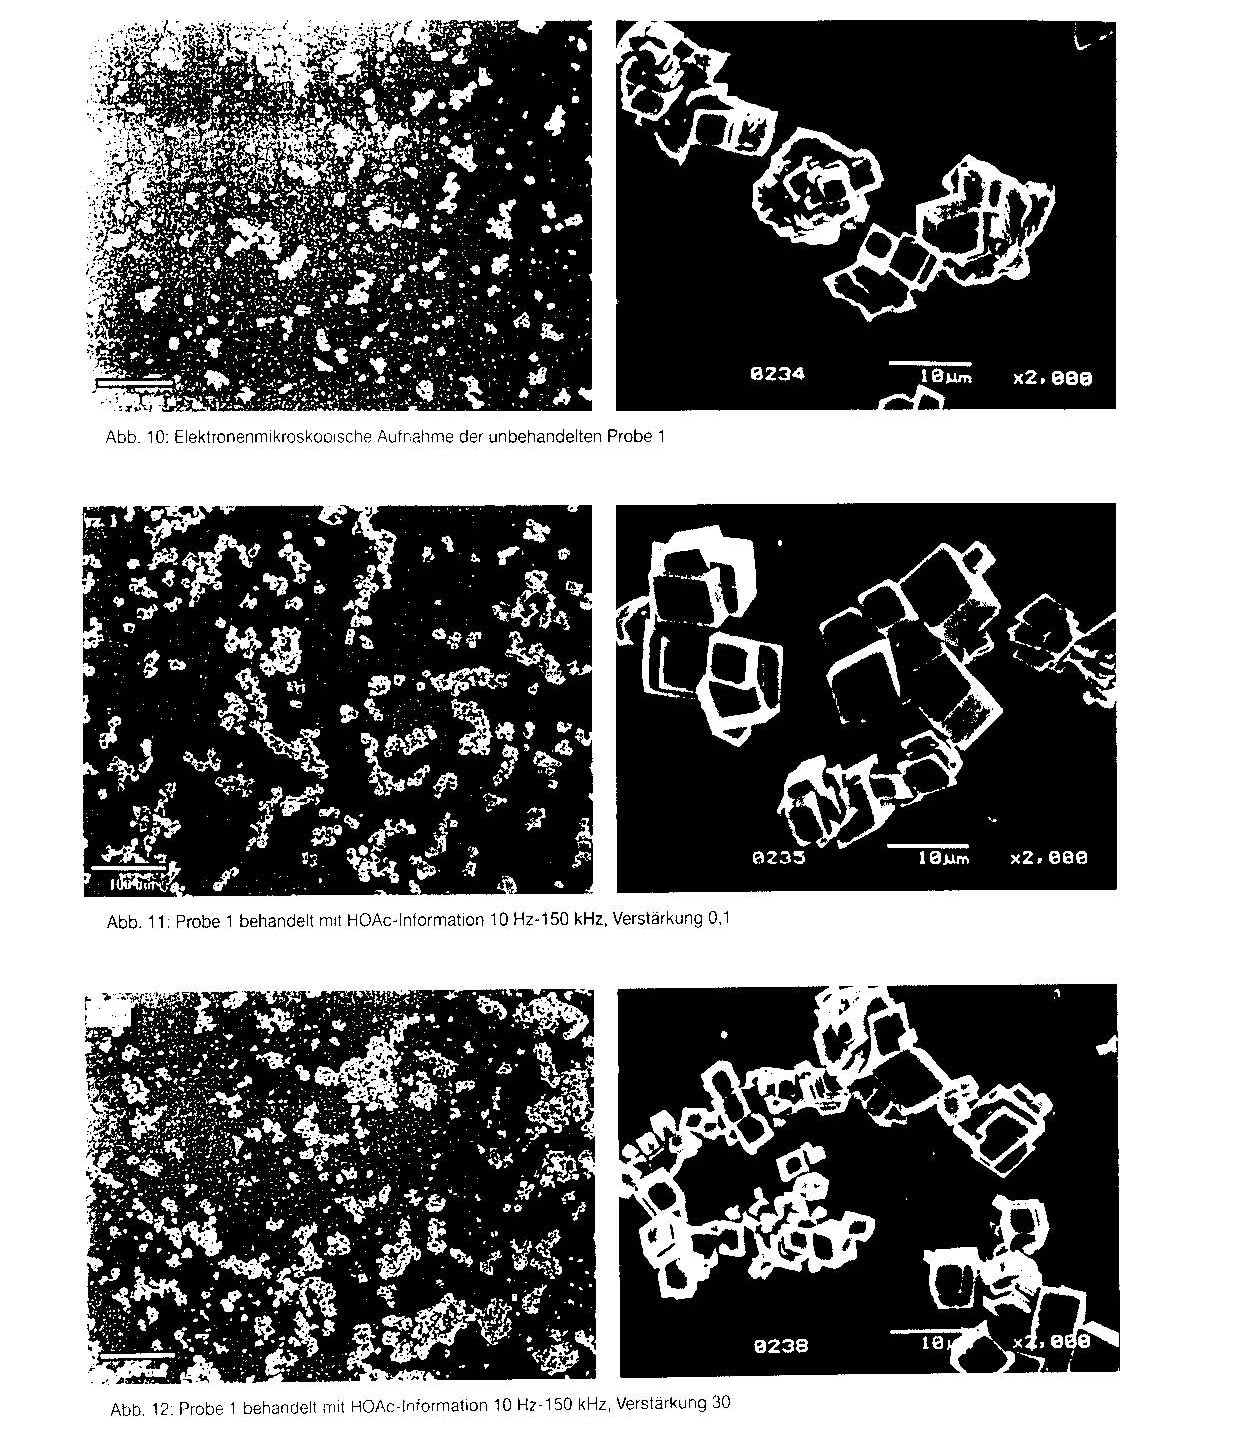
A representative selection of electron microscope images is given in figures 10 to 15. Alongside each image at a magnification of 2000x is an overview image at a magnification of 200x, in order to document the uniformity of the preparation.
It can be seen from the figures that the effect of the transferred HOAc information also influences the number and habit of the crystals obtained from the sample solutions.
Fig. 10 shows untreated sample 1. Here, the largest crystals have an edge length of
about 6 p.m. The surfaces of the crystals are rough and crystallisation is incomplete
Fig. 11 shows crystals of sample 1 after treatment with HOAc information in the frequency range 10 Hz to 150 Hz, amplification 0,1. The crystals here are substantially larger (10 p.m) and are associated into agglomerates. At an amplification of 30 (fig. 12), the tendency to agglomerate increases greatly. Furthermore, in addition to the large crystals, a large number of small cubes can be seen.
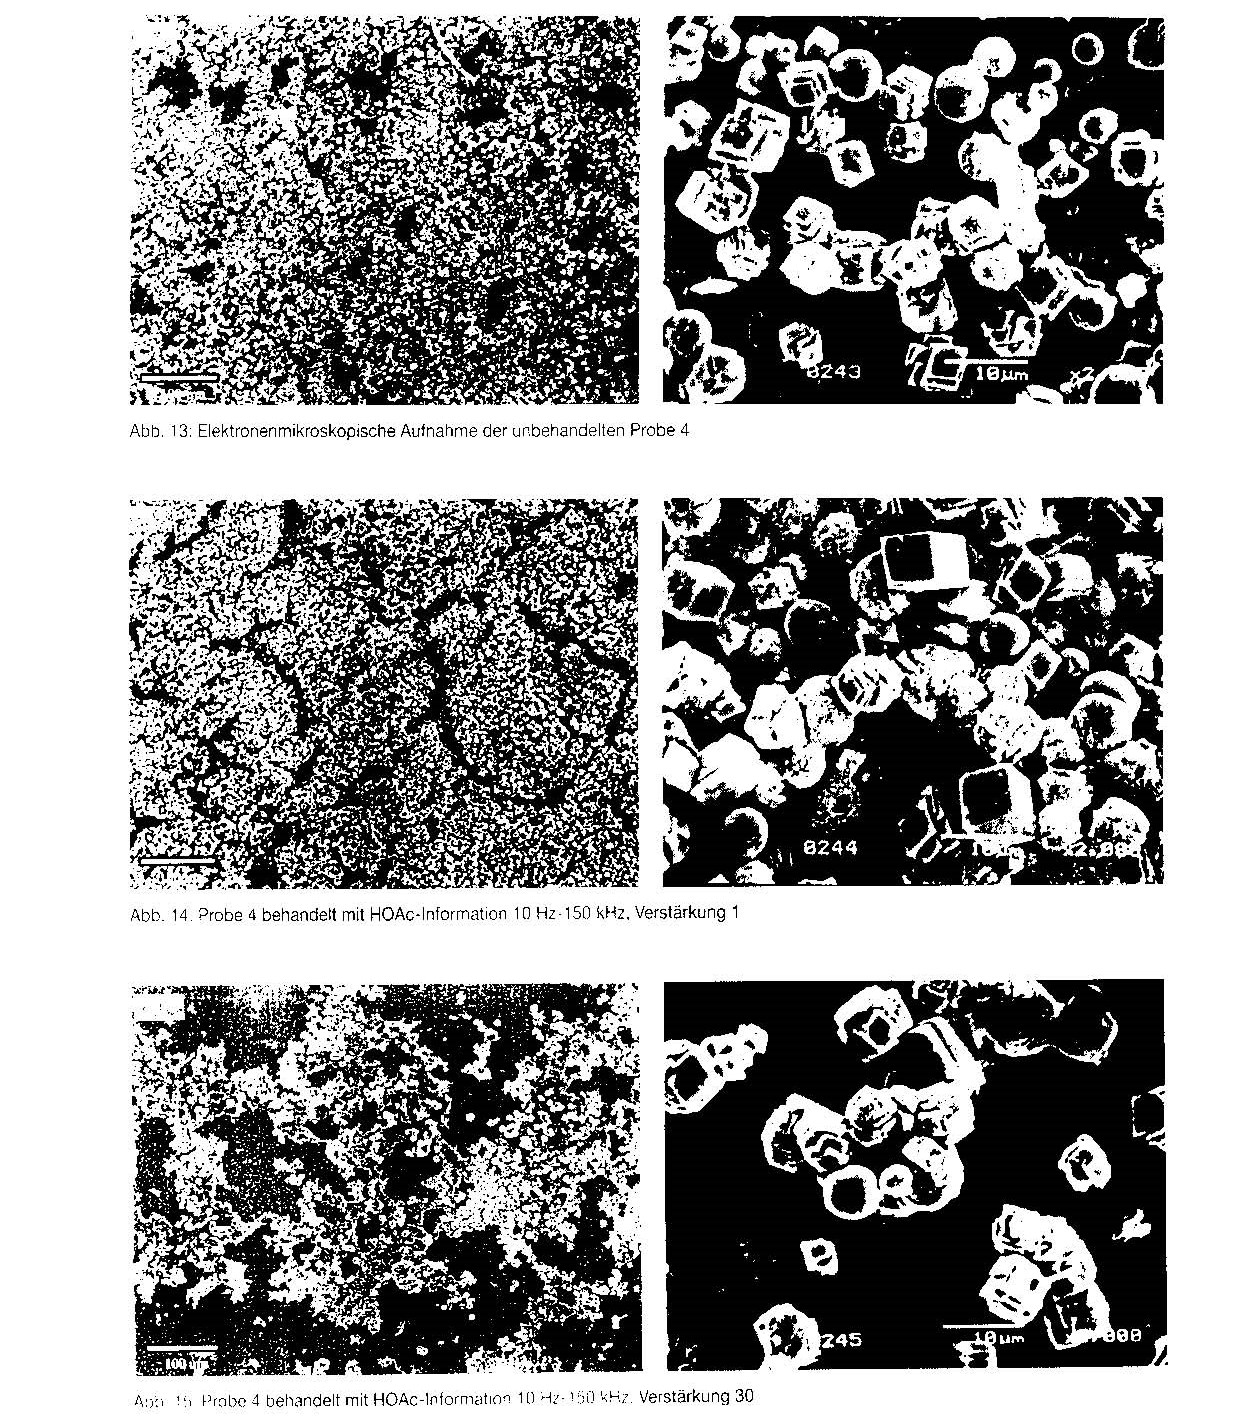
Similar behaviour can be seen in the case of sample 14 (figs. 13 to 15). Here again, the tendency to larger crystals and increasing production of agglomerates can be seen. These variations were also found for samples 2 and 3 cum grano salis, although the images are not reproduced here.
Accurate determination of fine structural changes in the crystal preparations (X-ray structural analysis) was not possible due to the small amounts of the samples.
References
Dr. rer. nat. Peter Kreisl, Dall-Arrni-Strasse 21 D-85435 Erding
Fig, 1 Kirlian photograph of untreated sample 1
Fig. 2 Sample 1 treated with HOAc information, 10 Hz — 150 kHz for 10 min, amplification 1
Fig. 3 Sample 1 treated with HOAc information, 10 Hz 150 kHz for 10 min, amplification 30
Fig 4 Kirlian photograph of untreated sample 2
Fig. 5 Sample 2 treated with HOAc information, 10 Hz — 150 kHz for 10 min, amplification 1
Fig. 6 Sample 2 treated with HOAc information, 10 Hz — 150 kHz for 10 min, amplification 30
Fig. 7 Kirlian photograph of untreated sample 4
Fig. 8 Sample 4 treated with HOAc information, 10 Hz — 150 kHz for 10 min, amplification 1
Fig. 9 Sample 4 treated with HOAc information, 10 Hz — 150 kHz for 10 min, amplification 30
Fig, 10 Electron microscope image of untreated sample 1
Fig. 11 Sample 1 treated with HOAc information, 10 Hz — 15 kHz, amplification 0.1 Fig, 12 Sample 1 treated with HOAc information, 10 Hz — 15 kHz, amplification 30 Fig. 13 Electron microscope image of untreated sample 4
Fig. 14 Sample 4 treated with HOAc information, 10 Hz — 15 kHz, amplification 1
Fig. 15 Sample 4 treated with HOAc information, 10 Hz — 15 kHz, amplification 30